
Microsoft Loop has continuously evolved since its official release in November 2023. It has been integrating with other Microsoft productivity applications and introducing novel data handling methods.
Dashboard Visualizations: A New Way to See Your Data
A recent update on the Microsoft 365 Insider blog unveiled a new feature for Loop users who prefer alternative formats to tables when viewing a team’s items. Now, users have the option to convert tables into dashboard visualizations.
Tables in Loop can be diverse, ranging from the Kanban Board to the Team Retrospective. Many companies and individuals find dashboard templates more convenient than tables.
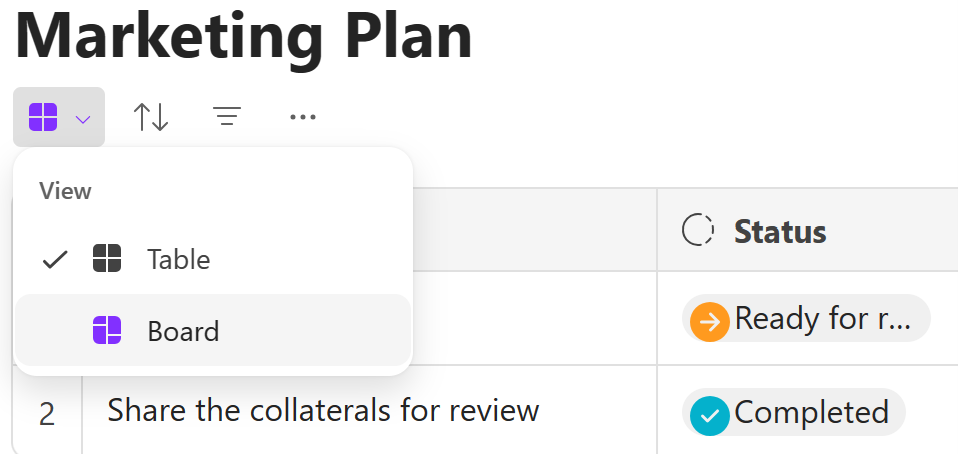
Now, Loop users can easily switch from a table-based component to a dashboard template. Navigate to the tablet-based component, choose the Change View option, and select the Dashboard option to convert the table into a dashboard template.
Boosting Collaboration with Dashboard Visualizations
Microsoft has introduced various ways to utilize Loop Tables’ new dashboard display feature, catering to teams and individuals alike. Users can generate cards, incorporate new fields or properties into existing cards, reposition cards across rows or lanes to assign them to different project stages, adjust lane visibility and priority status, and duplicate existing cards as templates when adding related tasks.
To convert a Loop list into a board template, users must ensure they have at least one column of text data type and one column of label data type in their Loop list. They can also pivot the data to the table’s first label data type column.
While initially announced on the Microsoft 365 Insider site, the new dashboard visualization feature for Loop table components is now accessible to all Microsoft 365 subscribers. This follows Microsoft’s recent announcement that its Copilot generative AI software for Microsoft 365 is now available to all Windows desktop users.


